Tutoiral:
Query Hi-C interactions Here we demonstrate how to query the chromatin interactions for regions surrounding SHH (Sonic Hedgehog) gene. We can visualize this region by selecting human and hg19 from the drop-down for species and genome assembly, and then typing in the gene name SHH in the textbox. Our browser auto-fills gene names as users type, based a variety of gene annotations, including refSeq, UCSC and ensemble gene sets.
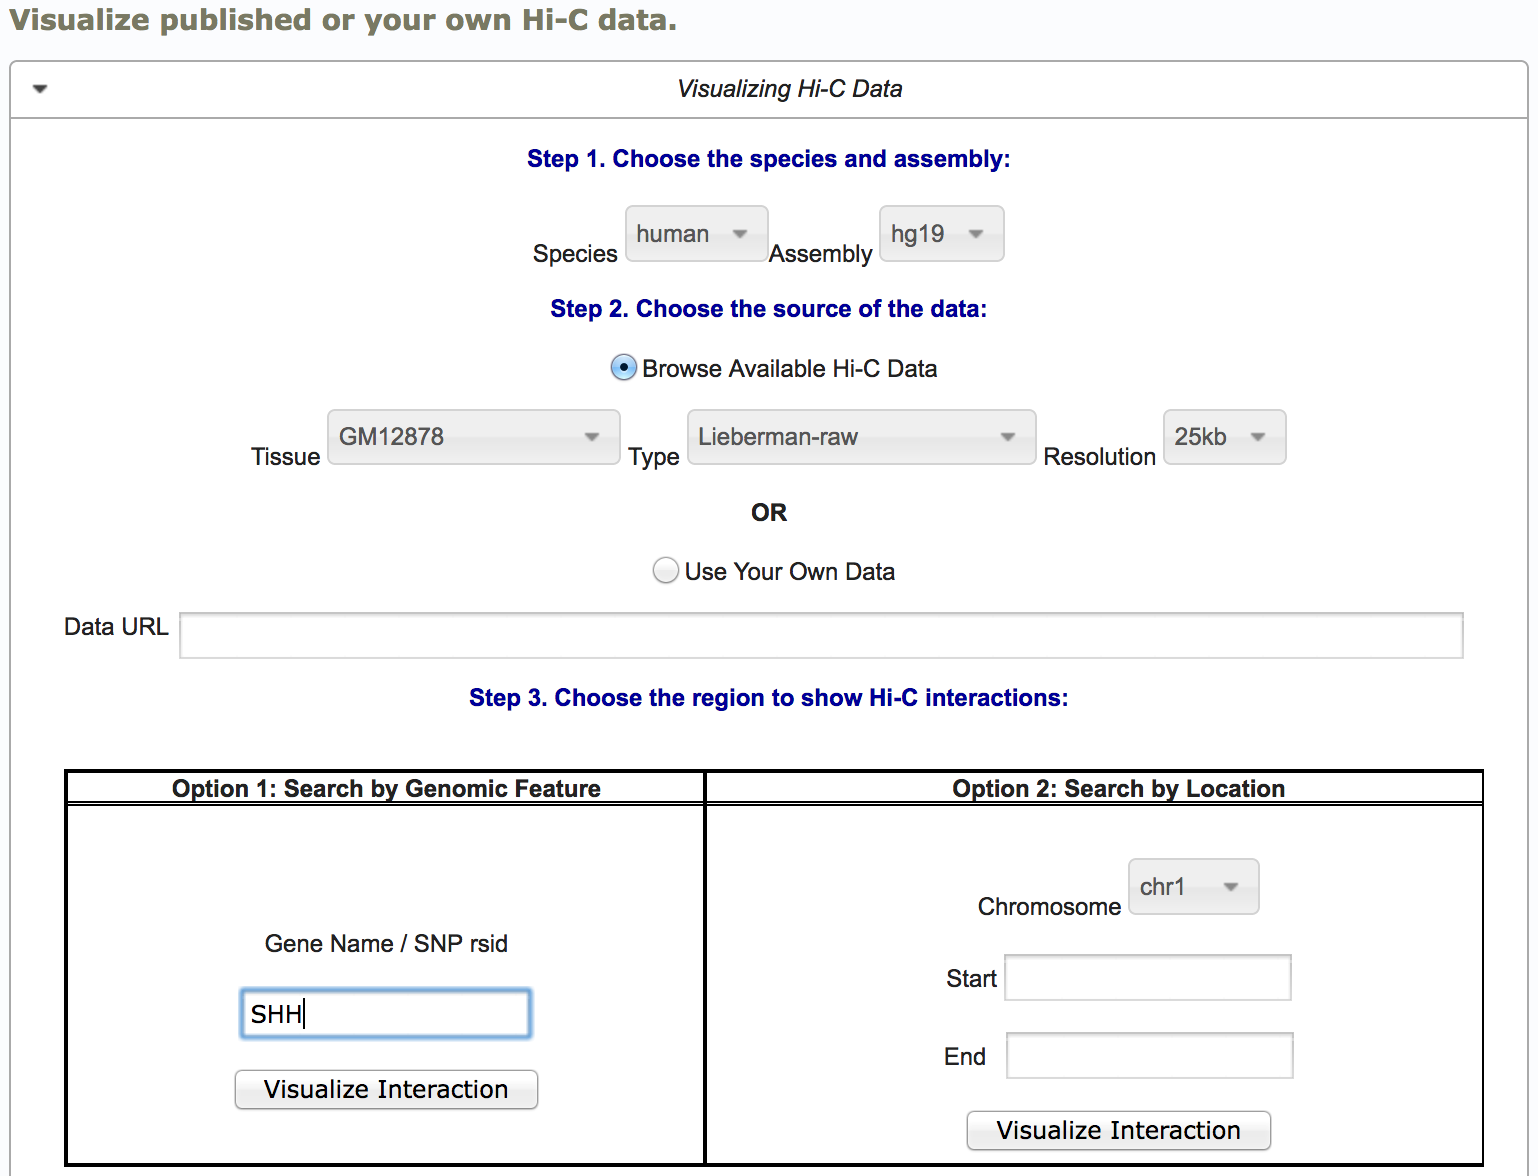
After clicking the submit button, the Hi-C interactions in GM12878 for the queried gene are shown on the right panel. For Hi-C data with multiple resolutions (bin sizes), there is another dropdown menu for users to choose the appropriate size according to their needs. In Figure below, we display the 25kb resolution Hi-C matrix, published in Rao et al Cell 2014. Once the initial HiC heatmap is displayed, there are several other function buttons to further assist users to explore around this region, such as zoom in/out and move to right/left. To make the Hi-C interaction more visible, users can conveniently adjust the color bar on the same page.
Under the heatmap, we also imbed the UCSC genome browser for the same region, so that the users can explore both the chromatin interaction and other "omics" data simultaneously. In this case, we display the tracks for RNA-Seq and H3K27ac (active enhancer mark) ChIP-Seq data for the same cell type. In this region, there is a known enhancer (marked by green bar) that regulate the SHH gene17. We observe that this known enhancer and the promoter of SHH are located within the same TAD and the long range interaction between them is also evident in the Hi-C map, marked by the black arrow
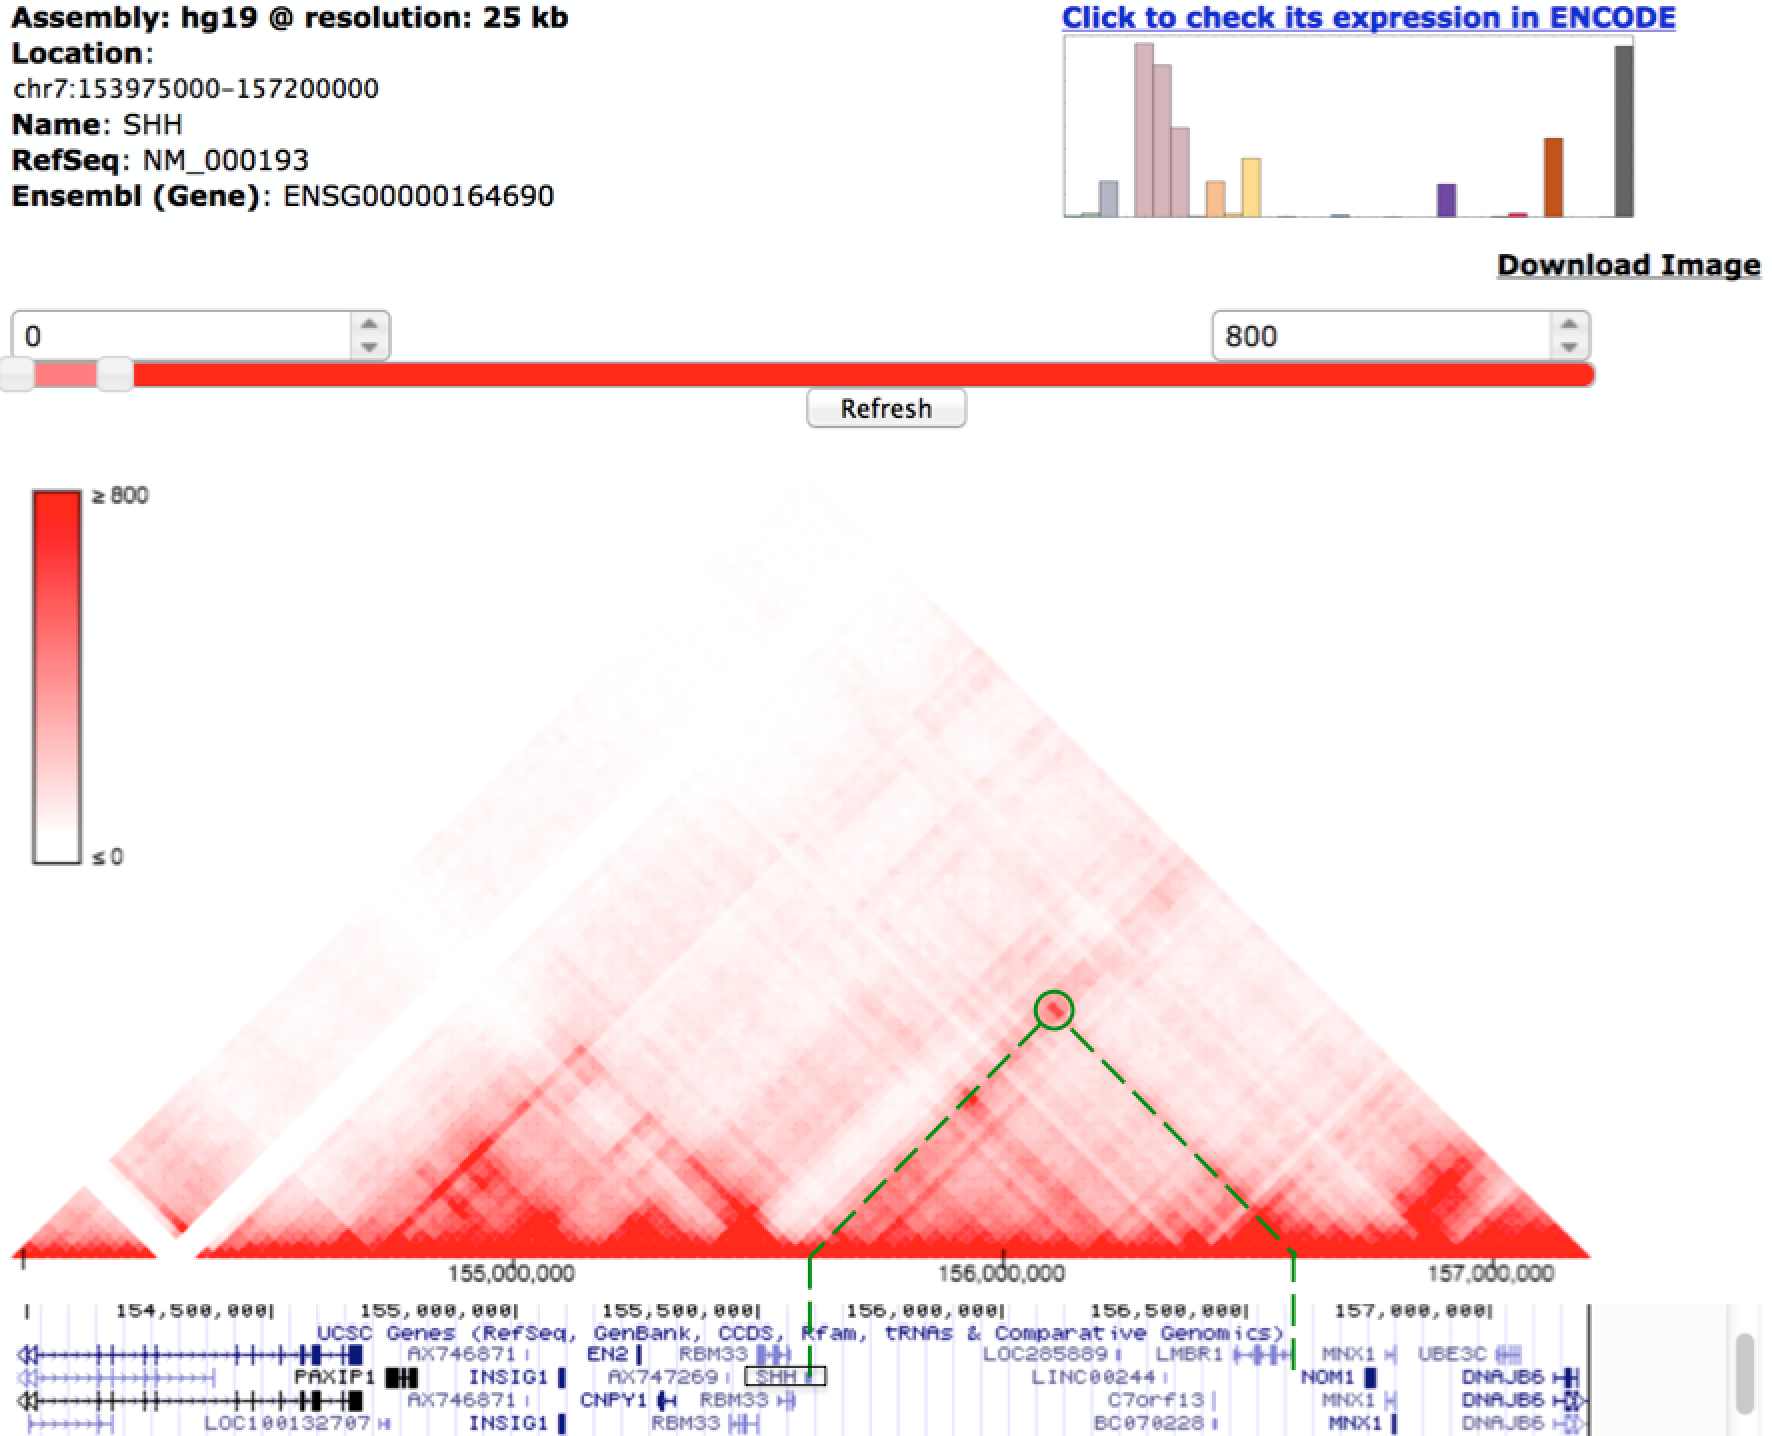
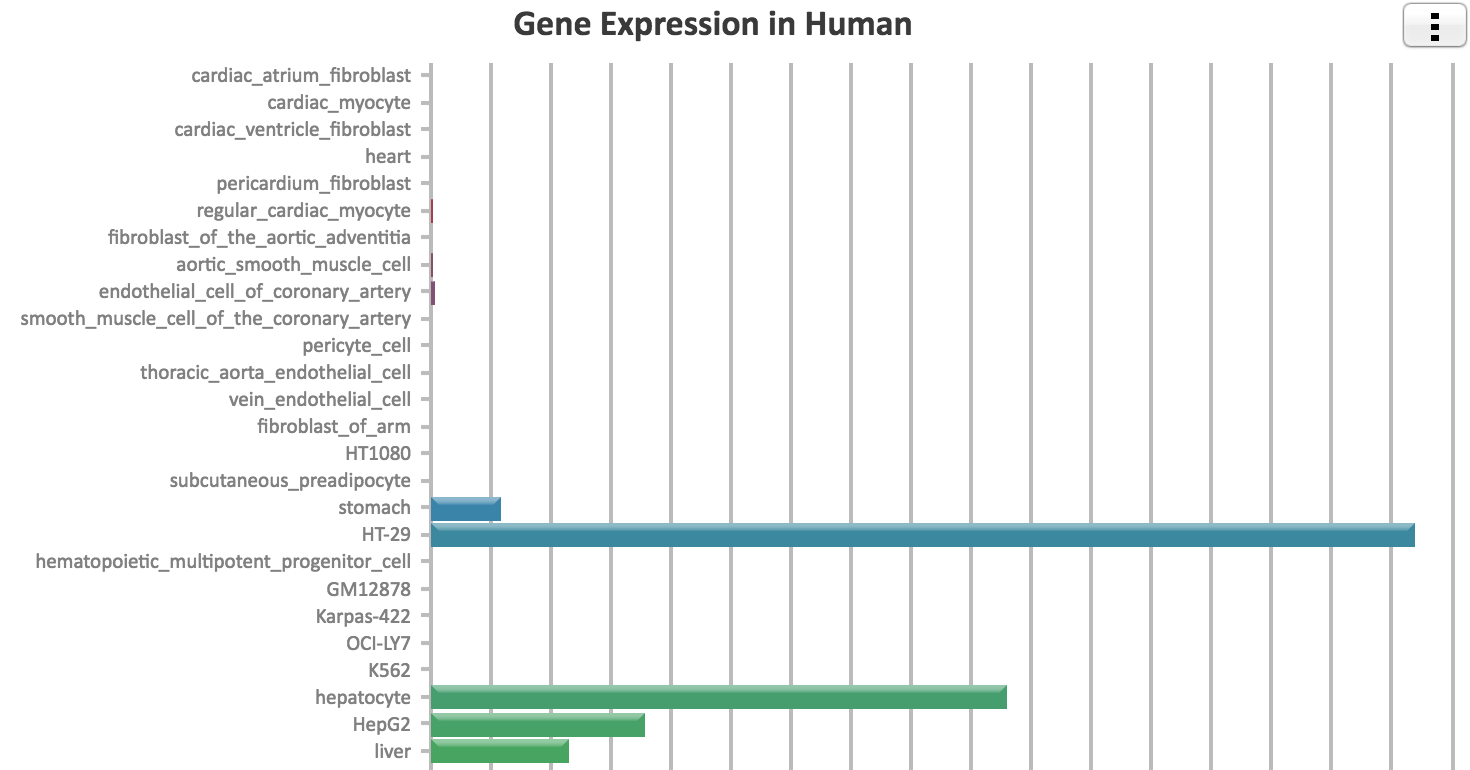
You can also conveniently check the expression for the queried the genes across over 100 cell types profiled by the ENCODE project. Simply click the "Check gene expression on the top right corner of this page.
Identify Linkage between Genes, Enhancers and SNPs Although displaying Hi-C data as a heatmap is informative to visualize large genome structures such as TADs, it is not intuitive to show interactions between two specific loci. For example, many users are interested in using Hi-C data to explore enhancer-promoter interactions. To facilitate users with this goal, we implemented the following three methods in our 3D Genome browser:
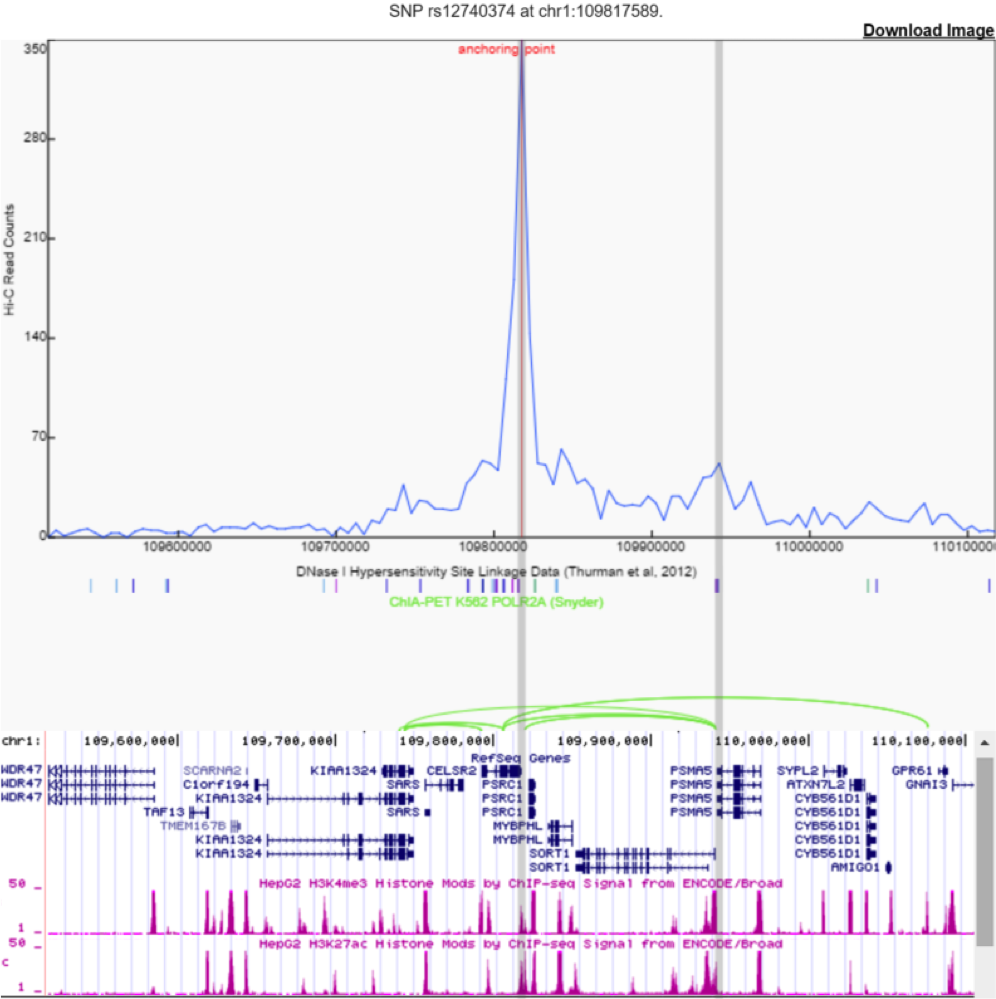
Virtual 4C: Circular chromosomal conformation capture(4C) is a chromatin ligation-based method that surveys for one-vs-many interactions in the genome, that is, to measure the interaction frequencies between a bait locus of interest and any other loci. 4C data is plotted as a curve line, where the center is the bait region and a peak signal in distal region indicates there is a chromatin interaction event. In our browser, we use the queried region as bait (either a gene name or a SNP ID), and extract a row of Hi-C data centered on the bait region, hence, virtual 4C. ChIA-PET: another implementation of chromatin ligation-based method, which detects long-range interactions between genomic regions that are enriched for a feature (either histone modification or transcription factor binding). Each pairwise ChIA-PET interaction is visualized as elliptical arcs in our browser. DHS-Linkage: ENCODE Consortium profiled DHS in more than 100 cell types, and therefore making it possible to compute Pearson correlation coefficients for all distal DHS with gene proximal DHS. Between each pair of distal-proximal DHSs, you can compute a Pearson correlation based their tissue-specificity. For more details, please check out ENCODE Consortium Nature 2012 and Thurman et al, Nature 2012.
We incorporated these three methods in our browser. In the below figure, we show an example by querying rs12740374, a SNPs that has been associated with coronary heart disease19. This SNP is located within a candidate enhancer region, marked by H3K27Ac as shown in the UCSC genome browser. In this case, virtual 4C, ChIA-PET and DHS-Linkage all support that there is the potential interaction between the enhancer harboring this SNP and the promoter region of PSMA5, which is implicated in heart disease20. By integrating multiple lines of evidence, our browser provides a valuable resource for investigators to create hypotheses connecting distal non-coding variant, distal regulatory elements and their target gene.
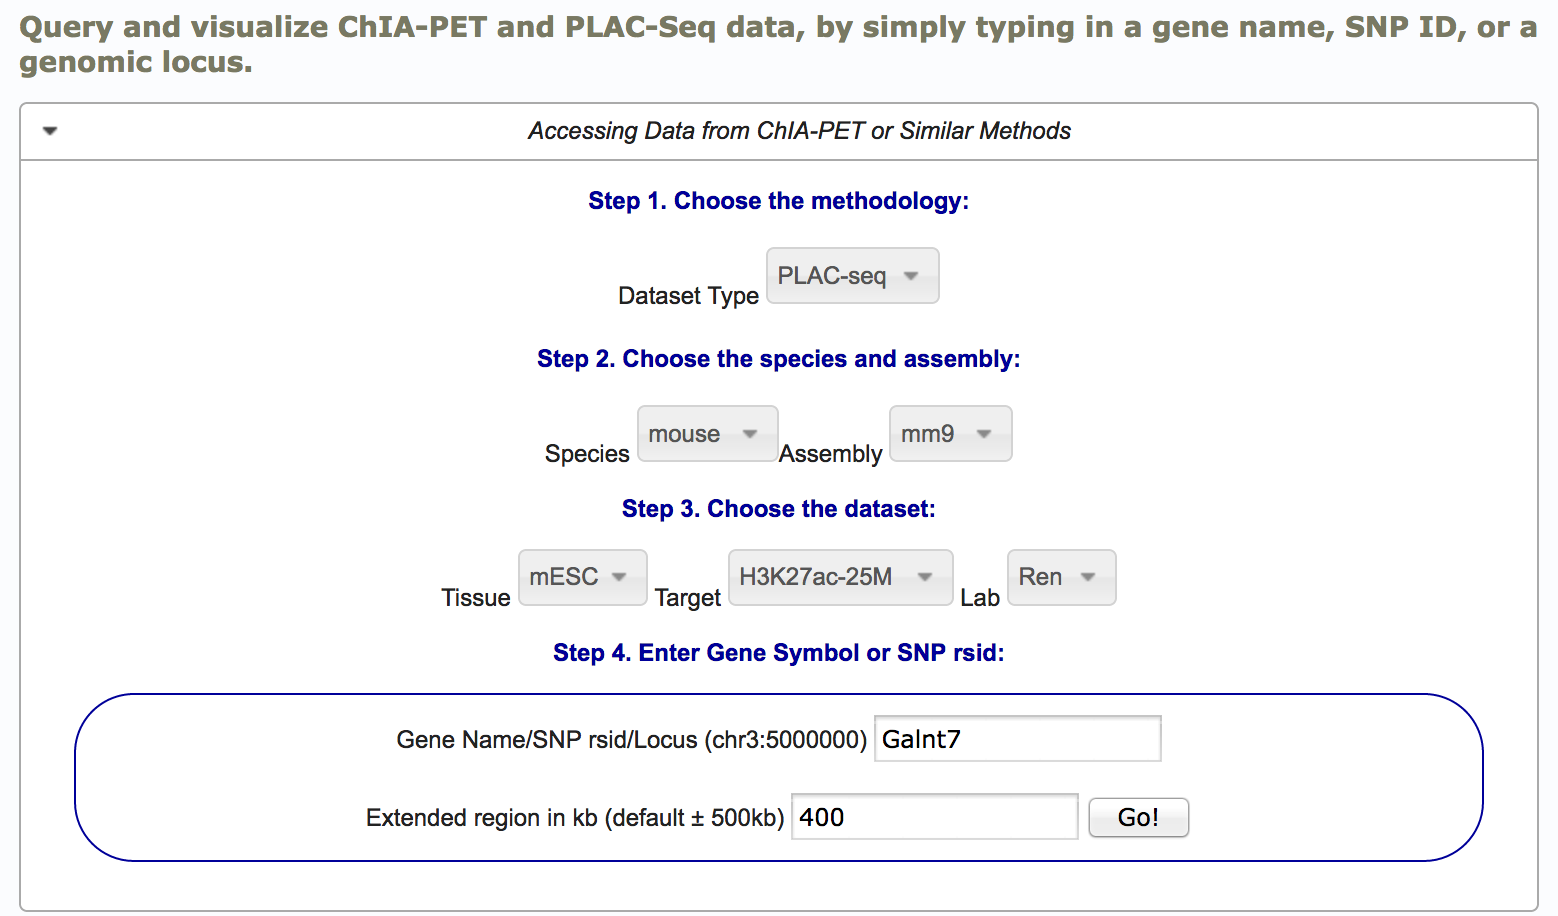
Visualizing ChIA-PET or Capture Hi-C data The main difference for visualizing Hi-C and ChIA-PET/Capture Hi-C is that Hi-C is usually displayed as a heatmap, while the other format are shown as arcs. Here we will use the PLAC-Seq (a datatype similar to ChIA-PET) to show chromatin interactions surrounding Galnt7 in mESC as an example.
From dropdown menu, choose PLAC-Seq, mouse, mm9, mESC, H3K27ac-mm9. Type in the gene name "Galnt7" and query its surrounding 400kb. Click "Go".
All the chromatin interactions predicted by PLAC-Seq in this region are displayed on screen. The exact interaction loci are listed at the bottom of this page.
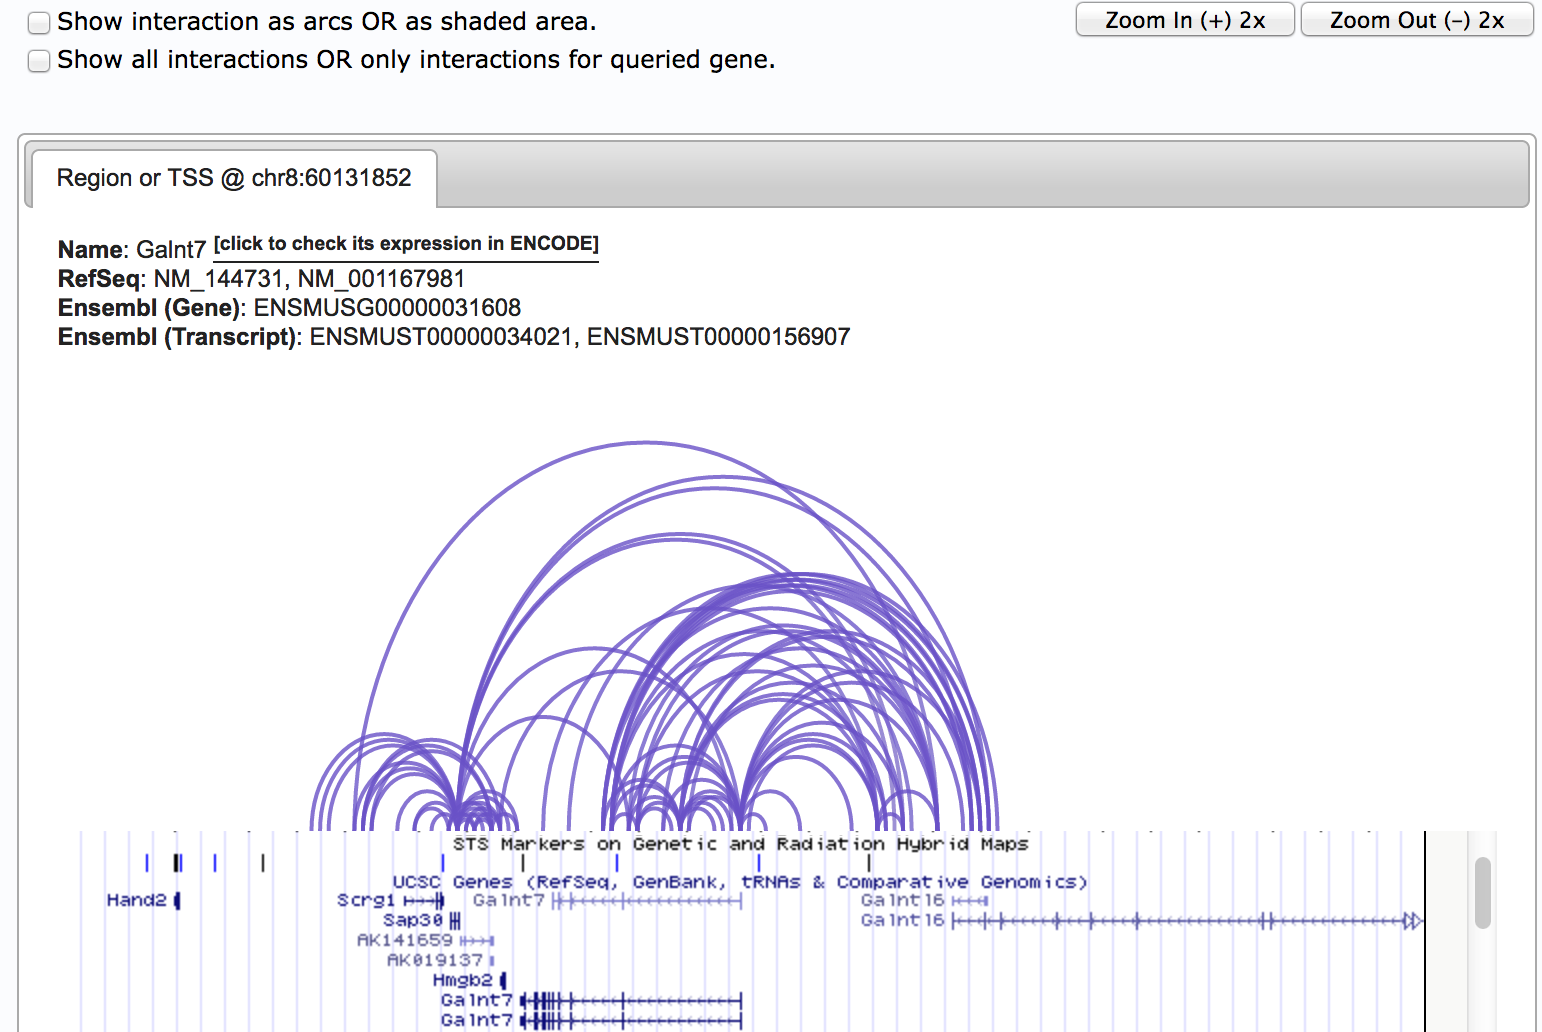
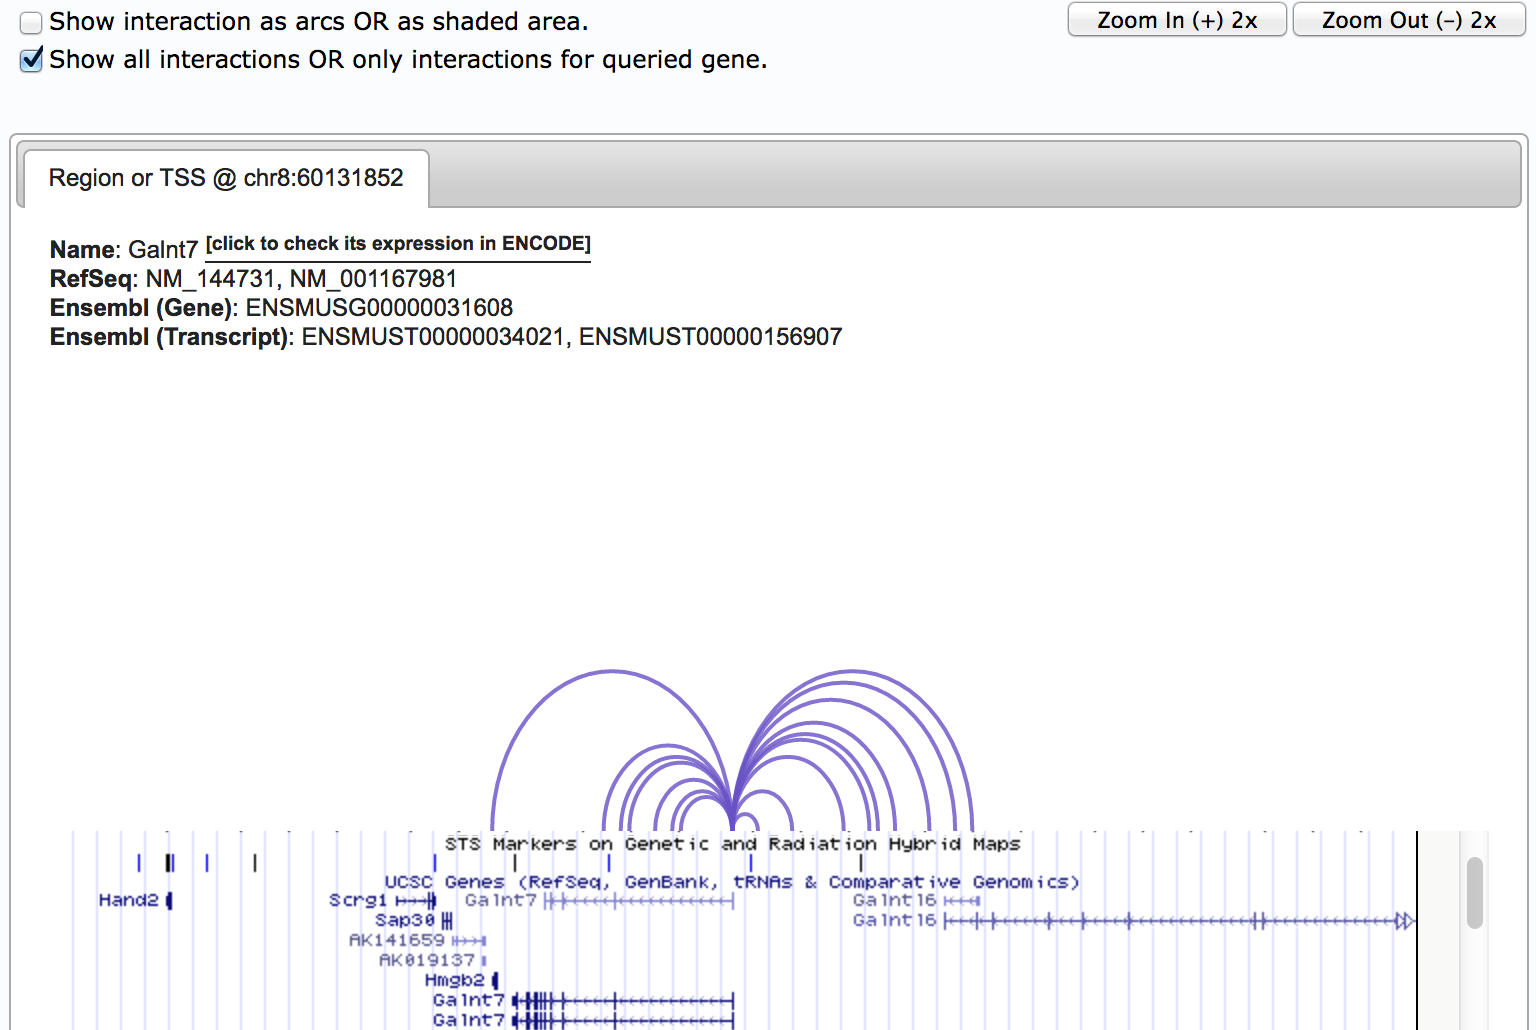
By check the "Show all interactions OR only interactions for queried gene", you can convert between showing all the interactions in this region, or ONLY show interactions with the queried gene. This function is particularly useful when there are lots of interactions in this region. Further, checking "Show interaction as arcs OR as shaded area" will give you differnt style for displaying the interactions.
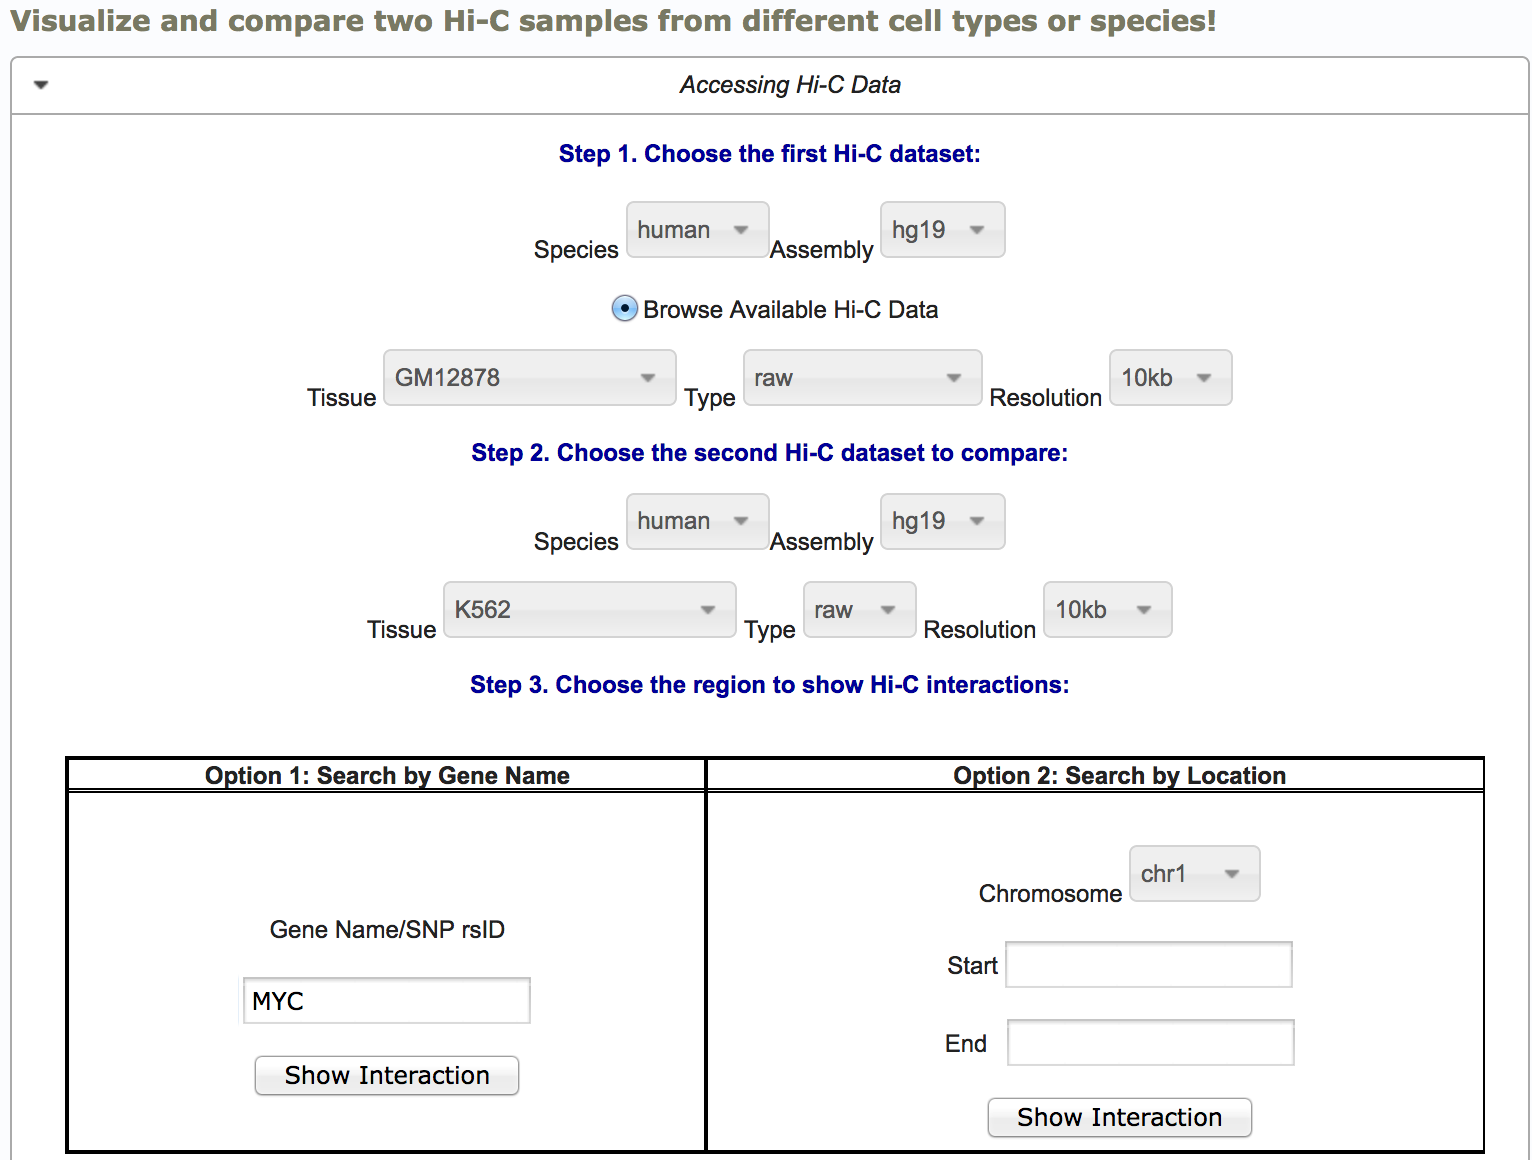
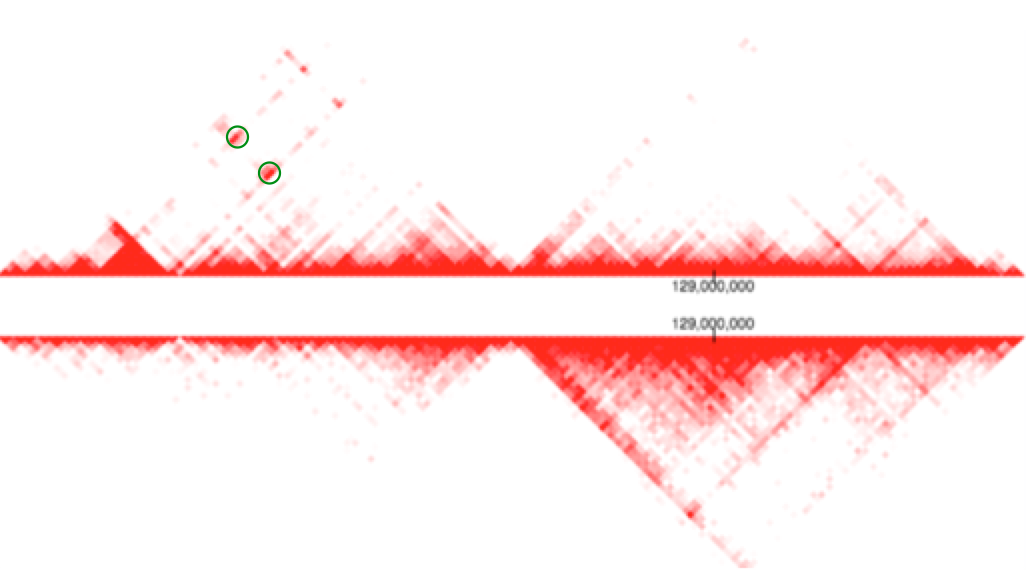
Compare different Hi-C samples: You can visualize Hi-C data from different cell types/conditions or even differnet species in the compare Hi-C page. Just choose the Hi-C source data from the dropdown menu and then type in a gene name or region. In the example, we are querying myc gene in GM and K562 cell types at 10kb resolution.
The Hi-C interaction maps for the chosen two cell types are displayed below. The green circles indicate two potential GM12878 cell-type specific interactions.
Use your own data: Our browser supports users to use their own data, including chromatin interaction data, ChIP-Seq and RNA-Seq data. This allows investigators to use our tool to analyze un-published data. To use their own epigenomics/genomics data, users only need to provide a UCSC genome browser session ID. As shown in the "Identify Linkage between Genes, Enhancers and SNPs" section, we display a user-defined session that contains RNA-Seq and ChIP-Seq for H3K27ac data in GM12878 cells.
To use their own Hi-C data, uses need to convert the Hi-C n x n matrix to an indexed binary file format that we recently developed, namely Binary Upper TrianguLar MatRix (BUTLR file). The new binary file enables the remote access of contact matrix hosted on any HTTP-supported servers. It also greatly increases the query speed, as the index directly points queries to the region of interest rather than searching through the whole matrix. The BUTLR format also dramatically reduces the storage space of contact matrix files, not only through the binarization but also through the omission of redundant values. For example, a 1-kb hg19 intrachromosomal Hi-C contact matrix requires ~1 TB of storage for the tab-delimited matrix file and ~32GB for the coordinated list format. In comparison, the BUTLR format only needs ~11GB of storage. To convert contact matrices to BUTLR files, please use BUTLRTools available at Github and check out the BUTLR tutorial here.
The tutorial is being updated with the new version of the 3D Genome Browser. If you have any questions or concerns, please feel free to contact us.